The Galaxy Zoo is a crowdsourced astronomy project which invites people to assist in the morphological classification of large numbers of galaxies. With the advent of novel telescopes, astronomers have the luxury of a very large number of observations; it is not easy though to go through them and understand (that is, to classify) what the objects are. The idea was then to crowdsource the classification to all the volunteers, with each image given to several of them. The answers, which may differ substantially in some cases, are then used to compute probability distributions for the different classes. The questions are:
- Is the object a smooth galaxy, a galaxy with features/disk or a star? 3 responses
- Is it edge-on? 2 responses
- Is there a bar? 2 responses
- Is there a spiral pattern? 2 responses
- How prominent is the central bulge? 4 responses
- Is there anything “odd” about the galaxy? 2 responses
- How round is the smooth galaxy? 3 responses
- What is the odd feature? 7 responses
- What shape is the bulge in the edge-on galaxy? 3 responses
- How tightly wound are the spiral arms? 3 responses
- How many spiral arms are there? 6 responses
The questions form a decision tree, copied below from Willett et al., 2013.
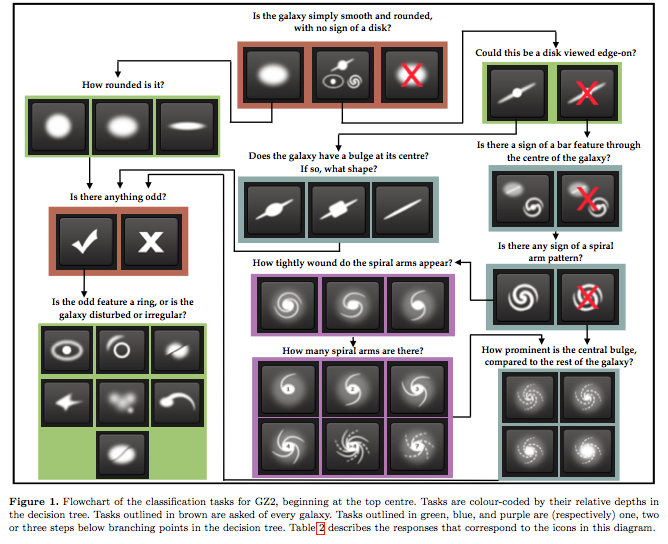
For most of the questions, all responses lead to the same follow-up question. Unlike a typical decision tree, the destination isn’t the defining characteristic of the object being analyzed. Rather, it’s a process to build a list of attributes that describe a given galaxy: rather than clearly defined classes here we have probabilities. As such, this is not a classical classification task, but rather a regression task.
What are interested here is the Galaxy Zoo Kaggle competition, which provides the data and guidance. This competition of quite old and many resources can be found on how to solve it. The best is probably the GitHub repo of the 2014 winner, which contains many interesting details and comments on what has to be done and why. For the exploratory data analysis this is well done, and some of it is repeated here.
Our first step in this journey is take the images and the solutions for the training set and try to understand them, which is the subject of this post. We will also try simple models, while the next post is dedicated to more serious ones. The data has been downloaded from the dedicated page on the Kaggle website.
import matplotlib.pylab as plt
import numpy as np
import pandas as pd
from pathlib import Path
import seaborn as sns
The data from Kaggle has been downloaded and unzipped. The location is given by IMG_DIR.
IMG_DIR = Path(r'data\images_training_rev1')
labels = pd.read_csv('./data/training_solutions_rev1.csv')
print(f"Found {len(labels)} entries with {len(labels.columns)} columns.")
Found 61578 entries with 38 columns.
The desc list below provides a short yet human-readable version of the questions.
desc = [
    'Smooth', 'Featured or disc', 'Star or artifact',
    'Edge on', 'Not edge on',
    'Bar through center', 'No bar',
    'Spiral', 'No Spiral',
    'No bulge', 'Just noticeable bulge', 'Obvious bulge', 'Dominant bulge',
    'Odd Feature', 'No Odd Feature',
    'Completely round', 'In between', 'Cigar shaped',
    'Ring (Oddity)', 'Lens or arc (Oddity)', 'Disturbed (Oddity)', 'Irregular (Oddity)',
        'Other (Oddity)', 'Merger (Oddity)', 'Dust lane (Oddity)',
    'Rounded bulge', 'Boxy bulge', 'No bulge',
    'Tightly wound arms', 'Medium wound arms', 'Loose wound arms',
    '1 Spiral Arm', '2 Spiral Arms', '3 Spiral Arms', '4 Spiral Arms', 'More than four Spiral Arms', "Can't tell"
]
Some questions are easy to analyze. The first question is the simplest: is the object a galaxy or not, and if it is, is it smooth and rounded or does it have some features or a disk. Non-galaxies are extremely rate, at less than 0.1% – clearly, we won’t be able to build a model that filters out anomalous data. Smooth and non-smooth are roughly balanced.
num_smooth_galaxies = sum(labels['Class1.1'] >= 0.5)
num_disk_galaxies = sum(labels['Class1.2'] >= 0.5)
num_non_galaxies = sum(labels['Class1.3'] >= 0.5)
print(f"# galaxies that are simply smooth and rounded: {num_smooth_galaxies}")
print(f"# galaxies with features or disk: {num_disk_galaxies}")
print(f"# star or artifacts: {num_non_galaxies}")
# galaxies that are simply smooth and rounded: 25868
# galaxies with features or disk: 34114
# star or artifacts: 44
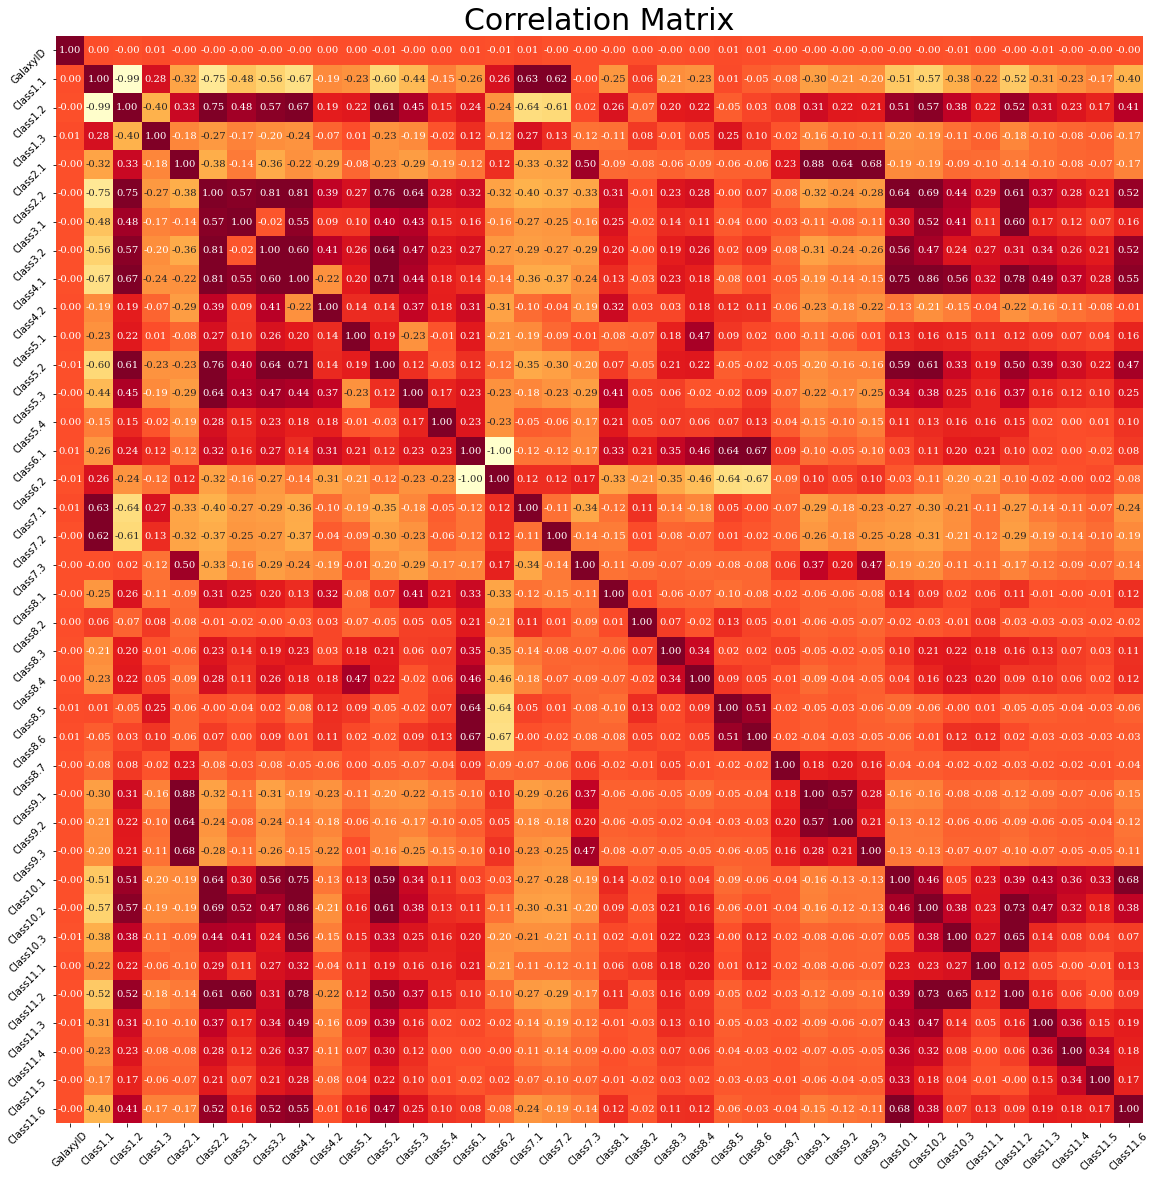
The heatmap of the correlations is instructive and can help us to reduce the number of features. First, we plot the overall correlation matrix, then we focus on the correlation amongst the values for the different answers.
plt.figure(figsize=[20,20])
plt.title("Correlation Matrix", fontsize=30)
sns.heatmap(labels.corr(), vmax=0.6, square=True, annot=True, cmap='YlOrRd', cbar=False,
            fmt=".2f",
            annot_kws={
                'fontsize': 10,
                'fontfamily': 'serif'
            })
plt.yticks(rotation = 45)
plt.xticks(rotation = 45);
groups = [
    ['Class1.1', 'Class1.2', 'Class1.3'],
    ['Class2.1', 'Class2.2'],
    ['Class3.1', 'Class3.2'],
    ['Class4.1', 'Class4.2'],
    ['Class5.1', 'Class5.2', 'Class5.3', 'Class5.4'],
    ['Class6.1', 'Class6.2'],
    ['Class7.1', 'Class7.2', 'Class7.3'],
    ['Class8.1', 'Class8.2', 'Class8.3', 'Class8.4', 'Class8.5', 'Class8.6', 'Class8.7'],
    ['Class9.1','Class9.2','Class9.3'],
    ['Class10.1', 'Class10.2', 'Class10.3'],
    ['Class11.1','Class11.2','Class11.3','Class11.4','Class11.5','Class11.6']
]

size = 15
fig = plt.figure('Individual Question Heatmaps', figsize=[size, size * 3 / 4])
for i, group in enumerate(groups):
    fig.add_subplot(3, 4, i+1)
    plt.title('Class' + str(i+1) + '.n')
    sns.heatmap(labels[group].corr(), square=True, annot=True,  cmap='YlOrRd', cbar=False)
    plt.xticks([x + 0.5 for x in range(len(group))], labels=[s.replace('Class','') for s in group])
    plt.yticks([y + 0.5 for y in range(len(group))], labels=[s.replace('Class','') for s in group])
    #plt.xlabel(str(i))

fig.tight_layout(pad=3.0)
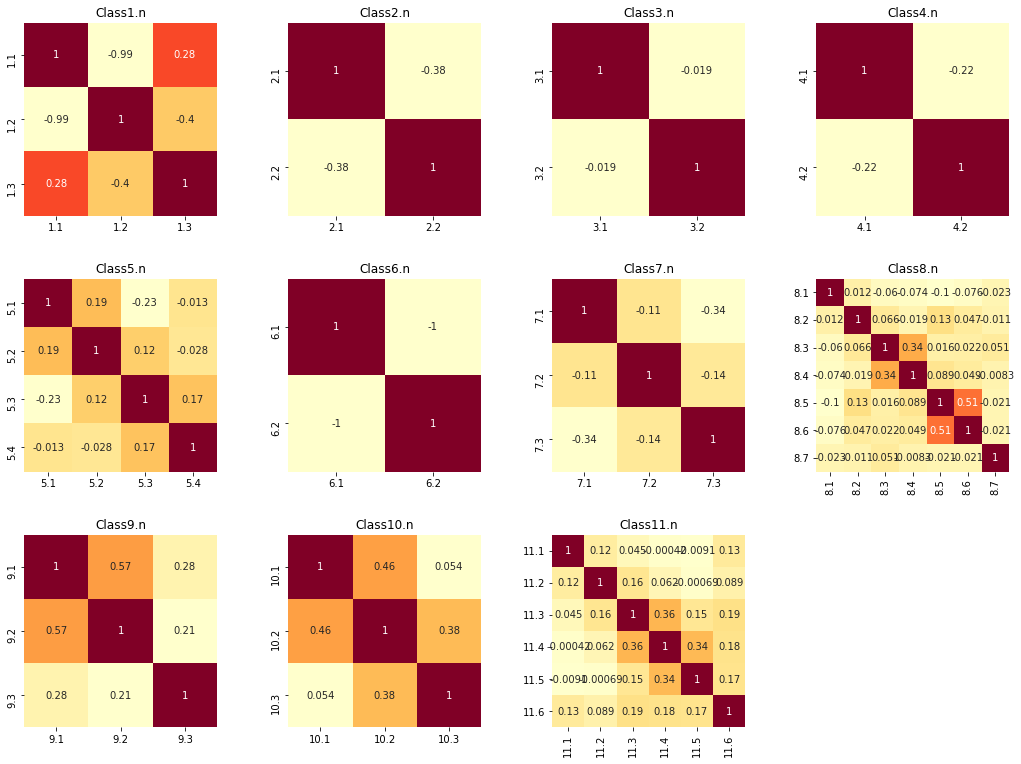
The first two answers of question 1 (galaxy smooth, or disk, or non-galaxy) are almost uncorrelated; the same is true for question 6 (on whether there is anything odd). Question 3 has very little correlation as well. Other questions are less clear – in question 6, there was some confusion between disturbed, irregular, and merged galaxies; in question 7, completely round and cigar shape have large correlations and may have been misclassified frequently; in question 9, the correlation is high, showing uncertainty in the answers; in question 11, people seem to agree little on galaxies having 3, 4 or 5 spirals. Things like this are a reminder that hand-labeled data doesn’t represent the absolute truth, but rather an approximation of the truth. Indeed, part of the challenge associated with this dataset is about modelling the human thought process behind answering these questions.
print("The highest confidence example for each answer / Feature.")
size = 15
fig = plt.figure('Image Examples', figsize=[size, size * 10 / 4])
plt.axis('off')
plt.tick_params(axis='both', left='off', top='off', right='off', bottom='off', labelleft='off', labeltop='off', labelright='off', labelbottom='off')
for i, feature in enumerate(labels.columns[1:]):
    fig.add_subplot(10, 4, i+1)
    plt.text(10, 25, feature, color='yellow', size=14)
    plt.text(10, 50, desc[i], color='yellow', size=14)
    plt.axis('off')
    plt.tick_params(axis='both', left='off', top='off', right='off', bottom='off', labelleft='off', labeltop='off', labelright='off', labelbottom='off')

    file = int(labels.iloc[labels[feature].idxmax()].GalaxyID)
    img = plt.imread(IMG_DIR / f'{file}.jpg', format='jpg')
    plt.imshow(img, aspect='auto')
fig.tight_layout(pad=1.0)
The highest confidence example for each answer / Feature.

As was pointed out by the participants to the challange, most of the interesting stuff is in the center of the image. A way of seeing it is by averaging a few images and check that there is little on the boundaries. We do this here using the first 5’000 images.
arr = np.array([plt.imread(IMG_DIR / f'{pic}.jpg', format='jpg') for pic in labels.GalaxyID[0:5000]])
plt.imshow(np.average(arr, axis=0).astype(int), aspect='auto')
plt.axis('off');
We are ready to build a simple regression model, using a mixture of PyTorch, for the image processing, and scikit-learn, for the regression model. We split the images into a training and test set, with 20% of the images in the test set.
from sklearn.model_selection import train_test_split
from sklearn.linear_model import LinearRegression
X_train, X_test, Y_train, Y_test = \
    train_test_split(labels.GalaxyID, labels[labels.columns[1:]],
                     test_size=0.20, random_state=42)
print(f"Training set size: {X_train.shape[0]}")
print(f"Testing set size: {X_test.shape[0]}")
Training set size: 49262
Testing set size: 12316
To load the images, we use PyTorch and a simple, custom Dataset class tailored to our needs.
import random
import torch
from torchvision.transforms import functional
from torchvision.io import read_image
from sklearn.metrics import mean_squared_error
from PIL import Image
class GalaxyDataset(torch.utils.data.Dataset):

    def __init__(self, X, Y, path, size, crop):
        self.X = X
        self.Y = Y
        self.path = path
        self.crop = crop
        self.size = size

    def __len__(self):
        return len(self.X)

    def __getitem__(self, idx):
        img = Image.open(self.path / f'{self.X.iloc[idx]}.jpg')
        if self.crop:
            img = functional.crop(img, 108, 108, 207, 207)
        img = functional.to_grayscale(functional.resize(img, self.size))
        return functional.to_tensor(img), torch.tensor(self.Y.iloc[idx])
dataset_nocrop = GalaxyDataset(X_train, Y_train, IMG_DIR, 256, crop=False)
dataset_crop = GalaxyDataset(X_train, Y_train, IMG_DIR, 32, crop=True)
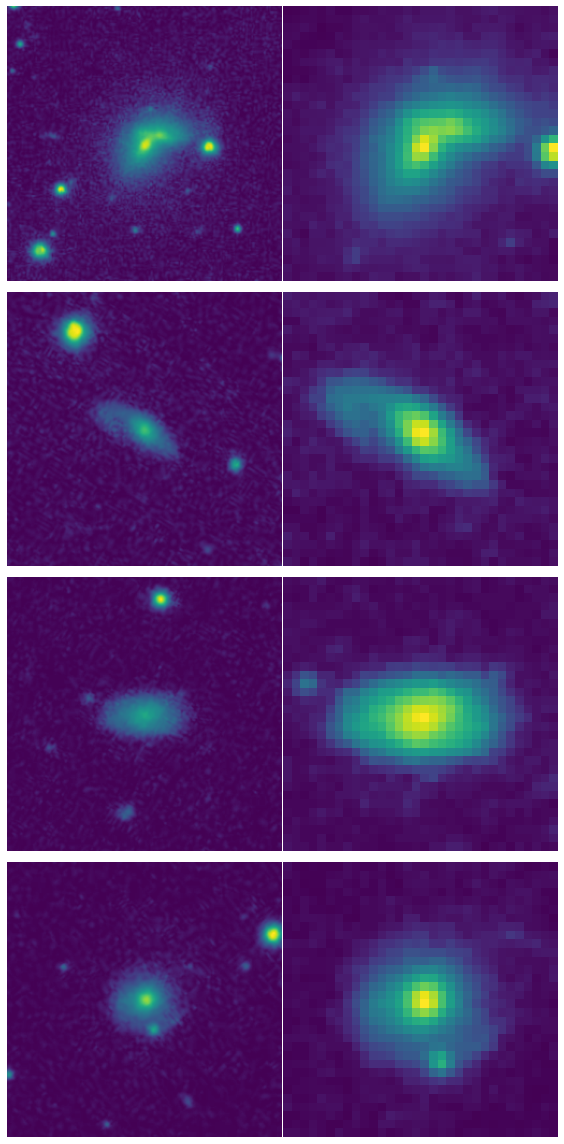
fig, axes = plt.subplots(figsize=(8, 16), nrows=4, ncols=2)
for i in range(4):
idx = random.randint(0, len(dataset_nocrop))
axes[i, 0].imshow(dataset_nocrop[idx][0].permute(1, 2, 0))
axes[i, 1].imshow(dataset_crop[idx][0].permute(1, 2, 0))
axes[i, 0].axis('off')
axes[i, 1].axis('off')
fig.tight_layout()
def prepare(X, Y, size):
    dataset = GalaxyDataset(X, Y, IMG_DIR, size, crop=True)
    dataloader = torch.utils.data.DataLoader(dataset, batch_size=1)
    X_prepared, Y_prepared = [], []
    for images_batch, labels_batch in dataloader:
        X_prepared.append(images_batch.flatten().numpy())
        Y_prepared.append(labels_batch.flatten().numpy())
    return np.array(X_prepared), np.array(Y_prepared)
X_train_8, Y_train_8 = prepare(X_train, Y_train, 8)
X_test_8, Y_test_8 = prepare(X_test, Y_test, 8)
The first model is the simplest – just the average value of each feature in the training set.
Y_pred = np.repeat(Y_train_8.mean(axis=0), len(Y_test_8)).reshape(-1, len(Y_test_8))
print(f"The RMSE is {mean_squared_error(Y_pred.flatten(), np.array(Y_test_8).flatten(), squared=False):.4f}")
The RMSE is 0.2888
The next model is more respectable and gives us a reasonable lower bound on which RMSE we can expect with more sophisticated models.
lr = LinearRegression()
lr.fit(X_train_8, Y_train_8)
Y_pred = lr.predict(X_test_8)
print(f"The RMSE is {mean_squared_error(Y_pred.flatten(), np.array(Y_test_8).flatten(), squared=False):.4f}")
The RMSE is 0.1527
In the next post we’ll see how to use convolutional neural networks for this task.