In this article we look at the data provided by the World Bank. The mission of the World Bank is to end extreme poverty and promote shared prosperity in a sustainable way. The task isn’t simple, and high-quality data is required to understand, plan and implement the initiatives to fulfill its mission and to eventually judge the failure or success of such initiatives. If the data is high-quality, it is also low-frequency, generally yearly, and mostly at the country level.
We will use the wbgapi Python package, which provides a nice and convenient interface to the web API of the World Bank Data service. In addition to the wbgapi package we only need standard Python packages. The environment is created with these commands:
$ python -m venv venv
$ ./venv/Scripts/activate
$ pip install pandas wbgapi ipykernel nbconvert matplotlib seaborn requests-cache
from datetime import datetime
import matplotlib.pylab as plt
import seaborn as sns
import pandas as pd
import wbgapi as wb
from IPython.display import Markdown
import requests_cache
requests_cache.install_cache()
sns.set_theme()
sns.set_context("paper")
The World Bank Data is structured around several databases, called sources in the wbgapi package. The list is returned by the .info() command.
wb.source.info()
| id | name | code | concepts | lastupdated |
|---|---|---|---|---|
| 1 | Doing Business | DBS | 3 | 2021-08-18 |
| 2 | World Development Indicators | WDI | 3 | 2023-05-10 |
| 3 | Worldwide Governance Indicators | WGI | 3 | 2022-09-23 |
| 5 | Subnational Malnutrition Database | SNM | 3 | 2016-03-21 |
| 6 | International Debt Statistics | IDS | 4 | 2022-12-06 |
| 11 | Africa Development Indicators | ADI | 3 | 2013-02-22 |
| 12 | Education Statistics | EDS | 3 | 2020-12-20 |
| 13 | Enterprise Surveys | ESY | 3 | 2022-03-25 |
| 14 | Gender Statistics | GDS | 3 | 2023-05-12 |
| 15 | Global Economic Monitor | GEM | 3 | 2020-07-27 |
| 16 | Health Nutrition and Population Statistics | HNP | 3 | 2023-05-12 |
| 18 | IDA Results Measurement System | IDA | 3 | 2021-07-23 |
| 19 | Millennium Development Goals | MDG | 3 | 2018-09-19 |
| 20 | Quarterly Public Sector Debt | PSD | 3 | 2023-04-28 |
| 22 | Quarterly External Debt Statistics SDDS | QDS | 3 | 2023-04-27 |
| 23 | Quarterly External Debt Statistics GDDS | QDG | 3 | 2023-04-27 |
| 25 | Jobs | JOB | 3 | 2022-06-29 |
| 27 | Global Economic Prospects | GEP | 3 | 2023-01-10 |
| 28 | Global Financial Inclusion | FDX | 3 | 2023-04-12 |
| 29 | The Atlas of Social Protection: Indicators of Resilience and Equity | GSP | 3 | 2021-12-20 |
| 30 | Exporter Dynamics Database – Indicators at Country-Year Level | ED1 | 3 | 2016-03-31 |
| 31 | Country Policy and Institutional Assessment | CPI | 3 | 2022-09-15 |
| 32 | Global Financial Development | GFD | 3 | 2022-09-23 |
| 33 | G20 Financial Inclusion Indicators | G2F | 3 | 2019-02-27 |
| 34 | Global Partnership for Education | GPE | 3 | 2013-04-12 |
| 35 | Sustainable Energy for All | SE4 | 3 | 2018-06-30 |
| 37 | LAC Equity Lab | LEL | 3 | 2016-04-06 |
| 38 | Subnational Poverty | SNP | 3 | 2015-04-27 |
| 39 | Health Nutrition and Population Statistics by Wealth Quintile | HNQ | 3 | 2022-12-13 |
| 40 | Population estimates and projections | HPP | 3 | 2023-05-12 |
| 41 | Country Partnership Strategy for India (FY2013 - 17) | CPS | 3 | 2015-05-22 |
| 43 | Adjusted Net Savings | WAT | 3 | 2022-09-20 |
| 45 | Indonesia Database for Policy and Economic Research | IDD | 3 | 2022-08-11 |
| 46 | Sustainable Development Goals | SDG | 3 | 2022-07-22 |
| 50 | Subnational Population | SNT | 3 | 2017-09-21 |
| 54 | Joint External Debt Hub | JED | 3 | 2023-01-30 |
| 57 | WDI Database Archives | WDA | 4 | 2023-03-08 |
| 58 | Universal Health Coverage | UHC | 3 | 2019-04-25 |
| 59 | Wealth Accounts | WAC | 3 | 2021-10-27 |
| 60 | Economic Fitness | EFT | 3 | 2018-04-19 |
| 61 | PPPs Regulatory Quality | PRQ | 3 | 2019-04-25 |
| 62 | International Comparison Program (ICP) 2011 | ICP | 4 | 2020-08-24 |
| 63 | Human Capital Index | HCI | 3 | 2020-09-21 |
| 64 | Worldwide Bureaucracy Indicators | WBI | 3 | 2022-09-20 |
| 65 | Health Equity and Financial Protection Indicators | HPI | 3 | 2019-11-06 |
| 66 | Logistics Performance Index | LPI | 3 | 2019-10-29 |
| 67 | PEFA 2011 | PF1 | 4 | 2022-11-23 |
| 68 | PEFA 2016 | PF6 | 4 | 2023-04-28 |
| 69 | Global Financial Inclusion and Consumer Protection Survey | RFA | 3 | 2019-06-27 |
| 70 | Economic Fitness 2 | EF2 | 3 | 2022-07-21 |
| 71 | International Comparison Program (ICP) 2005 | IC5 | 4 | 2021-09-10 |
| 73 | Global Financial Inclusion and Consumer Protection Survey (Internal) | RFI | 3 | 2019-06-27 |
| 75 | Environment, Social and Governance (ESG) Data | ESG | 3 | 2023-05-19 |
| 76 | Remittance Prices Worldwide (Sending Countries) | RWS | 3 | 2020-12-07 |
| 77 | Remittance Prices Worldwide (Receiving Countries) | RWR | 3 | 2020-12-07 |
| 78 | ICP 2017 | IC7 | 4 | 2020-10-21 |
| 79 | PEFA_GRPFM | GRP | 4 | 2023-04-28 |
| 80 | Gender Disaggregated Labor Database (GDLD) | GDL | 4 | 2020-07-25 |
| 81 | International Debt Statistics: DSSI | DSI | 4 | 2022-12-06 |
| 82 | Global Public Procurement | GPP | 3 | 2021-03-24 |
| 83 | Statistical Performance Indicators (SPI) | SPI | 3 | 2021-04-01 |
| 84 | Education Policy | EDP | 3 | 2023-01-30 |
| 85 | PEFA_2021_SNG | SNG | 4 | 2023-04-19 |
| 86 | Global Jobs Indicators Database (JOIN) | JON | 3 | 2023-05-11 |
| 87 | Country Climate and Development Report (CCDR) | CCD | 3 | 2022-10-07 |
| 88 | Food Prices for Nutrition | FPN | 4 | 2023-03-30 |
| 89 | Identification for Development (ID4D) Data | ID4 | 3 | 2022-12-21 |
| 67 elements |
We will look at the WDI source, which is the default one. Each source contains several indicators, that is time series of country-wide quantities, for example the total population, the total population in a givn age range, the percentage of people that can read, and so on.
wb.db = 2
indicators = wb.series.info()
print(f'Found {len(indicators.table())} indicators.')
Found 1479 indicators.
Clearly there are many data sources. We will focus for the indicators related to the GDP (gross domestic product) and search for all the indicators that contain the word GDP in the name.
results = list(wb.search2('GDP', db=2))
selected_ids = []
for result in results:
    id, name = result.id, result.metadata.get('IndicatorName', None)
    if name is None or name.find('GDP') == -1:
        continue
    selected_ids.append(id)
text = ''
for id in selected_ids:
    metadata = wb.series.metadata.get(id).metadata
    long_def = metadata.get('Longdefinition', 'N/A').replace('\n', ' ').replace('|', '')
    source = metadata.get('Source', 'N/A').replace('\n', ' ').replace('|', '')
    text += f"| {id} | {metadata['IndicatorName']} | {long_def} | {source} |\n"
Markdown('| ID | Indicator Name | Long Description | Source |\n' '|---|---|---|---|\n'+ text)
| ID | Indicator Name | Long Description | Source |
|---|---|---|---|
| BG.GSR.NFSV.GD.ZS | Trade in services (% of GDP) | Trade in services is the sum of service exports and imports divided by the value of GDP, all in current U.S. dollars. | International Monetary Fund, Balance of Payments Statistics Yearbook and data files, and World Bank and OECD GDP estimates. |
| BM.KLT.DINV.GD.ZS | Foreign direct investment, net outflows (IMF-BoP, % of GDP) | Foreign direct investment are the net inflows of investment to acquire a lasting management interest (10 percent or more of voting stock) in an enterprise operating in an economy other than that of the investor. It is the sum of equity capital, reinvestment of earnings, other long-term capital, and short-term capital as shown in the balance of payments. This series shows net outflows of investment from the reporting economy to the rest of the world and is divided by GDP. | International Monetary Fund, International Financial Statistics and Balance of Payments databases, World Bank, International Debt Statistics, and World Bank and OECD GDP estimates. |
| BM.KLT.DINV.WD.GD.ZS | Foreign direct investment, net outflows (% of GDP) | Foreign direct investment refers to direct investment equity flows in an economy. It is the sum of equity capital, reinvestment of earnings, and other capital. Direct investment is a category of cross-border investment associated with a resident in one economy having control or a significant degree of influence on the management of an enterprise that is resident in another economy. Ownership of 10 percent or more of the ordinary shares of voting stock is the criterion for determining the existence of a direct investment relationship. This series shows net outflows of investment from the reporting economy to the rest of the world, and is divided by GDP. | International Monetary Fund, Balance of Payments database, supplemented by data from the United Nations Conference on Trade and Development and official national sources. |
| BN.CAB.XOKA.GD.ZS | Current account balance (% of GDP) | Current account balance is the sum of net exports of goods and services, net primary income, and net secondary income. | International Monetary Fund, Balance of Payments Statistics Yearbook and data files, and World Bank and OECD GDP estimates. |
| BN.KLT.PRVT.GD.ZS | Private capital flows, net (% of GDP) | Private capital flows consist of net foreign direct investment and portfolio investment. Foreign direct investment is net inflows of investment to acquire a lasting management interest (10 percent or more of voting stock) in an enterprise operating in an economy other than that of the investor. It is the sum of equity capital, reinvestment of earnings, other long-term capital, and short-term capital as shown in the balance of payments. The FDI included here is total net. Portfolio investment covers transactions in equity securities and debt securities. | International Monetary Fund, Balance of Payments Statistics Yearbook and data files, and World Bank and OECD GDP estimates. |
| BX.KLT.DINV.WD.GD.ZS | Foreign direct investment, net inflows (% of GDP) | Foreign direct investment are the net inflows of investment to acquire a lasting management interest (10 percent or more of voting stock) in an enterprise operating in an economy other than that of the investor. It is the sum of equity capital, reinvestment of earnings, other long-term capital, and short-term capital as shown in the balance of payments. This series shows net inflows (new investment inflows less disinvestment) in the reporting economy from foreign investors, and is divided by GDP. | International Monetary Fund, International Financial Statistics and Balance of Payments databases, World Bank, International Debt Statistics, and World Bank and OECD GDP estimates. |
| BX.TRF.PWKR.DT.GD.ZS | Personal remittances, received (% of GDP) | Personal remittances comprise personal transfers and compensation of employees. Personal transfers consist of all current transfers in cash or in kind made or received by resident households to or from nonresident households. Personal transfers thus include all current transfers between resident and nonresident individuals. Compensation of employees refers to the income of border, seasonal, and other short-term workers who are employed in an economy where they are not resident and of residents employed by nonresident entities. Data are the sum of two items defined in the sixth edition of the IMF’s Balance of Payments Manual: personal transfers and compensation of employees. | World Bank staff estimates based on IMF balance of payments data, and World Bank and OECD GDP estimates. |
| CM.MKT.LCAP.GD.ZS | Market capitalization of listed domestic companies (% of GDP) | Market capitalization (also known as market value) is the share price times the number of shares outstanding (including their several classes) for listed domestic companies. Investment funds, unit trusts, and companies whose only business goal is to hold shares of other listed companies are excluded. Data are end of year values. | World Federation of Exchanges database. |
| CM.MKT.TRAD.GD.ZS | Stocks traded, total value (% of GDP) | The value of shares traded is the total number of shares traded, both domestic and foreign, multiplied by their respective matching prices. Figures are single counted (only one side of the transaction is considered). Companies admitted to listing and admitted to trading are included in the data. Data are end of year values. | World Federation of Exchanges database. |
| DT.ODA.ODAT.GD.ZS | Net ODA received (% of GDP) | Net official development assistance (ODA) consists of disbursements of loans made on concessional terms (net of repayments of principal) and grants by official agencies of the members of the Development Assistance Committee (DAC), by multilateral institutions, and by non-DAC countries to promote economic development and welfare in countries and territories in the DAC list of ODA recipients. It includes loans with a grant element of at least 25 percent (calculated at a rate of discount of 10 percent). | Development Assistance Committee of the Organisation for Economic Co-operation and Development, Geographical Distribution of Financial Flows to Developing Countries, Development Co-operation Report, and International Development Statistics database. Data are available online at: www.oecd.org/dac/stats/idsonline. World Bank GDP estimates are used for the denominator. |
| EG.EGY.PRIM.PP.KD | Energy intensity level of primary energy (MJ/$2017 PPP GDP) | Energy intensity level of primary energy is the ratio between energy supply and gross domestic product measured at purchasing power parity. Energy intensity is an indication of how much energy is used to produce one unit of economic output. Lower ratio indicates that less energy is used to produce one unit of output. | World Bank, Sustainable Energy for All (SE4ALL) database from the SE4ALL Global Tracking Framework led jointly by the World Bank, International Energy Agency, and the Energy Sector Management Assistance Program. |
| EG.GDP.PUSE.KO.PP | GDP per unit of energy use (PPP $ per kg of oil equivalent) | GDP per unit of energy use is the PPP GDP per kilogram of oil equivalent of energy use. PPP GDP is gross domestic product converted to current international dollars using purchasing power parity rates based on the 2017 ICP round. An international dollar has the same purchasing power over GDP as a U.S. dollar has in the United States. | IEA Statistics © OECD/IEA 2014 (http://www.iea.org/stats/index.asp), subject to https://www.iea.org/t&c/termsandconditions/ |
| EG.GDP.PUSE.KO.PP.KD | GDP per unit of energy use (constant 2017 PPP $ per kg of oil equivalent) | GDP per unit of energy use is the PPP GDP per kilogram of oil equivalent of energy use. PPP GDP is gross domestic product converted to 2017 constant international dollars using purchasing power parity rates. An international dollar has the same purchasing power over GDP as a U.S. dollar has in the United States. | IEA Statistics © OECD/IEA 2014 (http://www.iea.org/stats/index.asp), subject to https://www.iea.org/t&c/termsandconditions/ |
| EG.USE.COMM.GD.PP.KD | Energy use (kg of oil equivalent) per $1,000 GDP (constant 2017 PPP) | Energy use per PPP GDP is the kilogram of oil equivalent of energy use per constant PPP GDP. Energy use refers to use of primary energy before transformation to other end-use fuels, which is equal to indigenous production plus imports and stock changes, minus exports and fuels supplied to ships and aircraft engaged in international transport. PPP GDP is gross domestic product converted to 2017 constant international dollars using purchasing power parity rates. An international dollar has the same purchasing power over GDP as a U.S. dollar has in the United States. | IEA Statistics © OECD/IEA 2014 (http://www.iea.org/stats/index.asp), subject to https://www.iea.org/t&c/termsandconditions/ |
| EN.ATM.CO2E.KD.GD | CO2 emissions (kg per 2015 US$ of GDP) | Carbon dioxide emissions are those stemming from the burning of fossil fuels and the manufacture of cement. They include carbon dioxide produced during consumption of solid, liquid, and gas fuels and gas flaring. | Climate Watch. 2020. GHG Emissions. Washington, DC: World Resources Institute. Available at: https://www.climatewatchdata.org/ghg-emissions. See NY.GDP.MKTP.KD for the denominator’s source. |
| EN.ATM.CO2E.PP.GD | CO2 emissions (kg per PPP $ of GDP) | Carbon dioxide emissions are those stemming from the burning of fossil fuels and the manufacture of cement. They include carbon dioxide produced during consumption of solid, liquid, and gas fuels and gas flaring. | Climate Watch. 2020. GHG Emissions. Washington, DC: World Resources Institute. Available at: https://www.climatewatchdata.org/ghg-emissions. See NY.GDP.MKTP.PP.CD for the denominator’s source. |
| EN.ATM.CO2E.PP.GD.KD | CO2 emissions (kg per 2017 PPP $ of GDP) | Carbon dioxide emissions are those stemming from the burning of fossil fuels and the manufacture of cement. They include carbon dioxide produced during consumption of solid, liquid, and gas fuels and gas flaring. | Climate Watch. 2020. GHG Emissions. Washington, DC: World Resources Institute. Available at: https://www.climatewatchdata.org/ghg-emissions. See NY.GDP.MKTP.PP.KD for the denominator’s source. |
| ER.GDP.FWTL.M3.KD | Water productivity, total (constant 2015 US$ GDP per cubic meter of total freshwater withdrawal) | Water productivity is calculated as GDP in constant prices divided by annual total water withdrawal. | Food and Agriculture Organization, AQUASTAT data, and World Bank and OECD GDP estimates. |
| FD.AST.PRVT.GD.ZS | Domestic credit to private sector by banks (% of GDP) | Domestic credit to private sector by banks refers to financial resources provided to the private sector by other depository corporations (deposit taking corporations except central banks), such as through loans, purchases of nonequity securities, and trade credits and other accounts receivable, that establish a claim for repayment. For some countries these claims include credit to public enterprises. | International Monetary Fund, International Financial Statistics and data files, and World Bank and OECD GDP estimates. |
| FM.AST.CGOV.GD.ZS | Claims on central government (% GDP) | Claims on central government (IFS line 32AN..ZK) include loans to central government institutions net of deposits. | International Monetary Fund, International Financial Statistics and data files, and World Bank and OECD GDP estimates. |
| FM.AST.PRVT.GD.ZS | Monetary Sector credit to private sector (% GDP) | Domestic credit to private sector refers to financial resources provided to the private sector, such as through loans, purchases of nonequity securities, and trade credits and other accounts receivable, that establish a claim for repayment. For some countries these claims include credit to public enterprises. | International Monetary Fund, International Financial Statistics and data files, and World Bank and OECD GDP estimates. |
| FM.LBL.BMNY.GD.ZS | Broad money (% of GDP) | Broad money (IFS line 35L..ZK) is the sum of currency outside banks; demand deposits other than those of the central government; the time, savings, and foreign currency deposits of resident sectors other than the central government; bank and traveler’s checks; and other securities such as certificates of deposit and commercial paper. | International Monetary Fund, International Financial Statistics and data files, and World Bank and OECD GDP estimates. |
| FM.LBL.MQMY.GD.ZS | Money and quasi money (M2) as % of GDP | Money and quasi money comprise the sum of currency outside banks, demand deposits other than those of the central government, and the time, savings, and foreign currency deposits of resident sectors other than the central government. This definition of money supply is frequently called M2; it corresponds to lines 34 and 35 in the International Monetary Fund’s (IMF) International Financial Statistics (IFS). | International Monetary Fund, International Financial Statistics and data files, and World Bank and OECD GDP estimates. |
| FS.AST.CGOV.GD.ZS | Claims on central government, etc. (% GDP) | Claims on central government (IFS line 52AN or 32AN) include loans to central government institutions net of deposits. | International Monetary Fund, International Financial Statistics and data files, and World Bank and OECD GDP estimates. |
| FS.AST.DOMO.GD.ZS | Claims on other sectors of the domestic economy (% of GDP) | Claims on other sectors of the domestic economy (IFS line 52S or 32S) include gross credit from the financial system to households, nonprofit institutions serving households, nonfinancial corporations, state and local governments, and social security funds. | International Monetary Fund, International Financial Statistics and data files, and World Bank and OECD GDP estimates. |
| FS.AST.DOMS.GD.ZS | Domestic credit provided by financial sector (% of GDP) | Domestic credit provided by the financial sector includes all credit to various sectors on a gross basis, with the exception of credit to the central government, which is net. The financial sector includes monetary authorities and deposit money banks, as well as other financial corporations where data are available (including corporations that do not accept transferable deposits but do incur such liabilities as time and savings deposits). Examples of other financial corporations are finance and leasing companies, money lenders, insurance corporations, pension funds, and foreign exchange companies. | International Monetary Fund, International Financial Statistics and data files, and World Bank and OECD GDP estimates. |
| FS.AST.PRVT.GD.ZS | Domestic credit to private sector (% of GDP) | Domestic credit to private sector refers to financial resources provided to the private sector by financial corporations, such as through loans, purchases of nonequity securities, and trade credits and other accounts receivable, that establish a claim for repayment. For some countries these claims include credit to public enterprises. The financial corporations include monetary authorities and deposit money banks, as well as other financial corporations where data are available (including corporations that do not accept transferable deposits but do incur such liabilities as time and savings deposits). Examples of other financial corporations are finance and leasing companies, money lenders, insurance corporations, pension funds, and foreign exchange companies. | International Monetary Fund, International Financial Statistics and data files, and World Bank and OECD GDP estimates. |
| FS.LBL.DPST.GD.ZS | Total financial system deposits (% of GDP) | N/A | International Monetary Fund, International Financial Statistics and data files. |
| FS.LBL.LIQU.GD.ZS | Liquid liabilities (M3) as % of GDP | Liquid liabilities are also known as M3. They are the sum of currency and deposits in the central bank (M0), plus transferable deposits and electronic currency (M1), plus time and savings deposits, foreign currency transferable deposits, certificates of deposit, and securities repurchase agreements (M2), plus travelers checks, foreign currency time deposits, commercial paper, and shares of mutual funds or market funds held by residents. | International Monetary Fund, International Financial Statistics and data files, and World Bank and OECD GDP estimates. |
| FS.LBL.QLIQ.GD.ZS | Quasi-liquid liabilities (% of GDP) | Quasi-liquid liabilities are the sum of currency and deposits in the central bank (M0), plus time and savings deposits, foreign currency transferable deposits, certificates of deposit, and securities repurchase agreements, plus travelers checks, foreign currency time deposits, commercial paper, and shares of mutual funds or market funds held by residents. They equal the M3 money supply less transferable deposits and electronic currency (M1). | International Monetary Fund, International Financial Statistics and data files, and World Bank and OECD GDP estimates. |
| GB.XPD.RSDV.GD.ZS | Research and development expenditure (% of GDP) | Expenditures for research and development are current and capital expenditures (both public and private) on creative work undertaken systematically to increase knowledge, including knowledge of humanity, culture, and society, and the use of knowledge for new applications. R&D covers basic research, applied research, and experimental development. | United Nations Educational, Scientific, and Cultural Organization (UNESCO) Institute for Statistics. |
| GC.AST.TOTL.GD.ZS | Net acquisition of financial assets (% of GDP) | Net acquisition of government financial assets includes domestic and foreign financial claims, SDRs, and gold bullion held by monetary authorities as a reserve asset. The net acquisition of financial assets should be offset by the net incurrence of liabilities. | International Monetary Fund, Government Finance Statistics Yearbook and data files. |
| GC.BAL.CASH.GD.ZS | Cash surplus/deficit (% of GDP) | Cash surplus or deficit is revenue (including grants) minus expense, minus net acquisition of nonfinancial assets. In the 1986 GFS manual nonfinancial assets were included under revenue and expenditure in gross terms. This cash surplus or deficit is closest to the earlier overall budget balance (still missing is lending minus repayments, which are now a financing item under net acquisition of financial assets). | International Monetary Fund, Government Finance Statistics Yearbook and data files, and World Bank and OECD GDP estimates. |
| GC.DOD.TOTL.GD.ZS | Central government debt, total (% of GDP) | Debt is the entire stock of direct government fixed-term contractual obligations to others outstanding on a particular date. It includes domestic and foreign liabilities such as currency and money deposits, securities other than shares, and loans. It is the gross amount of government liabilities reduced by the amount of equity and financial derivatives held by the government. Because debt is a stock rather than a flow, it is measured as of a given date, usually the last day of the fiscal year. | International Monetary Fund, Government Finance Statistics Yearbook and data files, and World Bank and OECD GDP estimates. |
| GC.FIN.DOMS.GD.ZS | Net incurrence of liabilities, domestic (% of GDP) | Net incurrence of government liabilities includes foreign financing (obtained from nonresidents) and domestic financing (obtained from residents), or the means by which a government provides financial resources to cover a budget deficit or allocates financial resources arising from a budget surplus. The net incurrence of liabilities should be offset by the net acquisition of financial assets (a third financing item). The difference between the cash surplus or deficit and the three financing items is the net change in the stock of cash. | International Monetary Fund, Government Finance Statistics Yearbook and data files, and World Bank and OECD GDP estimates. |
| GC.FIN.FRGN.GD.ZS | Net incurrence of liabilities, foreign (% of GDP) | Net incurrence of government liabilities includes foreign financing (obtained from nonresidents) and domestic financing (obtained from residents), or the means by which a government provides financial resources to cover a budget deficit or allocates financial resources arising from a budget surplus. The net incurrence of liabilities should be offset by the net acquisition of financial assets (a third financing item). The difference between the cash surplus or deficit and the three financing items is the net change in the stock of cash. | International Monetary Fund, Government Finance Statistics Yearbook and data files, and World Bank and OECD GDP estimates. |
| GC.LBL.TOTL.GD.ZS | Net incurrence of liabilities, total (% of GDP) | Net incurrence of government liabilities includes foreign financing (obtained from nonresidents) and domestic financing (obtained from residents), or the means by which a government provides financial resources to cover a budget deficit or allocates financial resources arising from a budget surplus. The net incurrence of liabilities should be offset by the net acquisition of financial assets. | International Monetary Fund, Government Finance Statistics Yearbook and data files. |
| GC.NFN.TOTL.GD.ZS | Net investment in nonfinancial assets (% of GDP) | Net investment in government nonfinancial assets includes fixed assets, inventories, valuables, and nonproduced assets. Nonfinancial assets are stores of value and provide benefits either through their use in the production of goods and services or in the form of property income and holding gains. Net investment in nonfinancial assets also includes consumption of fixed capital. | International Monetary Fund, Government Finance Statistics Yearbook and data files. |
| GC.NLD.PRIM.GD.ZS | Primary net lending / borrowing (% of GDP) | N/A | N/A |
| GC.NLD.TOTL.GD.ZS | Net lending (+) / net borrowing (-) (% of GDP) | Net lending (+) / net borrowing (–) equals government revenue minus expense, minus net investment in nonfinancial assets. It is also equal to the net result of transactions in financial assets and liabilities. Net lending/net borrowing is a summary measure indicating the extent to which government is either putting financial resources at the disposal of other sectors in the economy or abroad, or utilizing the financial resources generated by other sectors in the economy or from abroad. | International Monetary Fund, Government Finance Statistics Yearbook and data files. |
| GC.REV.TOTL.GD.ZS | Revenue (% of GDP) | Revenue is cash receipts from taxes, social contributions, and other revenues such as fines, fees, rent, and income from property or sales. Grants are also considered as revenue. | International Monetary Fund, Government Finance Statistics Yearbook and data files. |
| GC.REV.XGRT.GD.ZS | Revenue, excluding grants (% of GDP) | Revenue is cash receipts from taxes, social contributions, and other revenues such as fines, fees, rent, and income from property or sales. Grants are also considered as revenue but are excluded here. | International Monetary Fund, Government Finance Statistics Yearbook and data files, and World Bank and OECD GDP estimates. |
| GC.TAX.TOTL.GD.ZS | Tax revenue (% of GDP) | Tax revenue refers to compulsory transfers to the central government for public purposes. Certain compulsory transfers such as fines, penalties, and most social security contributions are excluded. Refunds and corrections of erroneously collected tax revenue are treated as negative revenue. | International Monetary Fund, Government Finance Statistics Yearbook and data files, and World Bank and OECD GDP estimates. |
| GC.XPN.TOTL.GD.ZS | Expense (% of GDP) | Expense is cash payments for operating activities of the government in providing goods and services. It includes compensation of employees (such as wages and salaries), interest and subsidies, grants, social benefits, and other expenses such as rent and dividends. | International Monetary Fund, Government Finance Statistics Yearbook and data files, and World Bank and OECD GDP estimates. |
| IT.TEL.REVN.GD.ZS | Telecommunications revenue (% GDP) | Telecommunications revenue is the revenue from the provision of telecommunications services such as fixed-line, mobile, and data. | International Telecommunication Union, World Telecommunication/ICT Development Report and database, and World Bank estimates. |
| MS.MIL.XPND.GD.ZS | Military expenditure (% of GDP) | Military expenditures data from SIPRI are derived from the NATO definition, which includes all current and capital expenditures on the armed forces, including peacekeeping forces; defense ministries and other government agencies engaged in defense projects; paramilitary forces, if these are judged to be trained and equipped for military operations; and military space activities. Such expenditures include military and civil personnel, including retirement pensions of military personnel and social services for personnel; operation and maintenance; procurement; military research and development; and military aid (in the military expenditures of the donor country). Excluded are civil defense and current expenditures for previous military activities, such as for veterans’ benefits, demobilization, conversion, and destruction of weapons. This definition cannot be applied for all countries, however, since that would require much more detailed information than is available about what is included in military budgets and off-budget military expenditure items. (For example, military budgets might or might not cover civil defense, reserves and auxiliary forces, police and paramilitary forces, dual-purpose forces such as military and civilian police, military grants in kind, pensions for military personnel, and social security contributions paid by one part of government to another.) | Stockholm International Peace Research Institute (SIPRI), Yearbook: Armaments, Disarmament and International Security. |
| NE.CON.GOVT.ZS | General government final consumption expenditure (% of GDP) | General government final consumption expenditure (formerly general government consumption) includes all government current expenditures for purchases of goods and services (including compensation of employees). It also includes most expenditures on national defense and security, but excludes government military expenditures that are part of government capital formation. | World Bank national accounts data, and OECD National Accounts data files. |
| NE.CON.PRVT.ZS | Households and NPISHs final consumption expenditure (% of GDP) | Household final consumption expenditure (formerly private consumption) is the market value of all goods and services, including durable products (such as cars, washing machines, and home computers), purchased by households. It excludes purchases of dwellings but includes imputed rent for owner-occupied dwellings. It also includes payments and fees to governments to obtain permits and licenses. Here, household consumption expenditure includes the expenditures of nonprofit institutions serving households, even when reported separately by the country. This item also includes any statistical discrepancy in the use of resources relative to the supply of resources. | World Bank national accounts data, and OECD National Accounts data files. |
| NE.CON.TOTL.ZS | Final consumption expenditure (% of GDP) | Final consumption expenditure (formerly total consumption) is the sum of household final consumption expenditure (private consumption) and general government final consumption expenditure (general government consumption). This estimate includes any statistical discrepancy in the use of resources relative to the supply of resources. | World Bank national accounts data, and OECD National Accounts data files. |
| NE.DAB.TOTL.ZS | Gross national expenditure (% of GDP) | Gross national expenditure (formerly domestic absorption) is the sum of household final consumption expenditure (formerly private consumption), general government final consumption expenditure (formerly general government consumption), and gross capital formation (formerly gross domestic investment). | World Bank national accounts data, and OECD National Accounts data files. |
| NE.EXP.GNFS.ZS | Exports of goods and services (% of GDP) | Exports of goods and services represent the value of all goods and other market services provided to the rest of the world. They include the value of merchandise, freight, insurance, transport, travel, royalties, license fees, and other services, such as communication, construction, financial, information, business, personal, and government services. They exclude compensation of employees and investment income (formerly called factor services) and transfer payments. | World Bank national accounts data, and OECD National Accounts data files. |
| NE.GDI.FPRV.ZS | Gross fixed capital formation, private sector (% of GDP) | Private investment covers gross outlays by the private sector (including private nonprofit agencies) on additions to its fixed domestic assets. | World Bank national accounts data, and OECD National Accounts data files. |
| NE.GDI.FPUB.ZS | GDFI, public sector (% of GDP) | N/A | World Bank national accounts data, and OECD National Accounts data files. |
| NE.GDI.FTOT.ZS | Gross fixed capital formation (% of GDP) | Gross fixed capital formation (formerly gross domestic fixed investment) includes land improvements (fences, ditches, drains, and so on); plant, machinery, and equipment purchases; and the construction of roads, railways, and the like, including schools, offices, hospitals, private residential dwellings, and commercial and industrial buildings. According to the 1993 SNA, net acquisitions of valuables are also considered capital formation. | World Bank national accounts data, and OECD National Accounts data files. |
| NE.GDI.TOTL.ZS | Gross capital formation (% of GDP) | Gross capital formation (formerly gross domestic investment) consists of outlays on additions to the fixed assets of the economy plus net changes in the level of inventories. Fixed assets include land improvements (fences, ditches, drains, and so on); plant, machinery, and equipment purchases; and the construction of roads, railways, and the like, including schools, offices, hospitals, private residential dwellings, and commercial and industrial buildings. Inventories are stocks of goods held by firms to meet temporary or unexpected fluctuations in production or sales, and “work in progress.” According to the 1993 SNA, net acquisitions of valuables are also considered capital formation. | World Bank national accounts data, and OECD National Accounts data files. |
| NE.IMP.GNFS.ZS | Imports of goods and services (% of GDP) | Imports of goods and services represent the value of all goods and other market services received from the rest of the world. They include the value of merchandise, freight, insurance, transport, travel, royalties, license fees, and other services, such as communication, construction, financial, information, business, personal, and government services. They exclude compensation of employees and investment income (formerly called factor services) and transfer payments. | World Bank national accounts data, and OECD National Accounts data files. |
| NE.RSB.GNFS.ZS | External balance on goods and services (% of GDP) | External balance on goods and services (formerly resource balance) equals exports of goods and services minus imports of goods and services (previously nonfactor services). | World Bank national accounts data, and OECD National Accounts data files. |
| NE.TRD.GNFS.ZS | Trade (% of GDP) | Trade is the sum of exports and imports of goods and services measured as a share of gross domestic product. | World Bank national accounts data, and OECD National Accounts data files. |
| NV.AGR.TOTL.ZS | Agriculture, forestry, and fishing, value added (% of GDP) | Agriculture, forestry, and fishing corresponds to ISIC divisions 1-3 and includes forestry, hunting, and fishing, as well as cultivation of crops and livestock production. Value added is the net output of a sector after adding up all outputs and subtracting intermediate inputs. It is calculated without making deductions for depreciation of fabricated assets or depletion and degradation of natural resources. The origin of value added is determined by the International Standard Industrial Classification (ISIC), revision 4. Note: For VAB countries, gross value added at factor cost is used as the denominator. | World Bank national accounts data, and OECD National Accounts data files. |
| NV.IND.MANF.ZS | Manufacturing, value added (% of GDP) | Manufacturing refers to industries belonging to ISIC divisions 15-37. Value added is the net output of a sector after adding up all outputs and subtracting intermediate inputs. It is calculated without making deductions for depreciation of fabricated assets or depletion and degradation of natural resources. The origin of value added is determined by the International Standard Industrial Classification (ISIC), revision 3. Note: For VAB countries, gross value added at factor cost is used as the denominator. | World Bank national accounts data, and OECD National Accounts data files. |
| NV.IND.MINQ.ZS | Mining and quarrying, value added (% of GDP) | Value added in mining and quarrying is defined as the value of output of the mining and quarrying industries less the value of intermediate consumption (intermediate inputs). Mining and quarrying is a subset of industry (ISIC 10-14). | World Bank national accounts data, and OECD National Accounts data files. |
| NV.IND.TOTL.ZS | Industry (including construction), value added (% of GDP) | Industry (including construction) corresponds to ISIC divisions 05-43 and includes manufacturing (ISIC divisions 10-33). It comprises value added in mining, manufacturing (also reported as a separate subgroup), construction, electricity, water, and gas. Value added is the net output of a sector after adding up all outputs and subtracting intermediate inputs. It is calculated without making deductions for depreciation of fabricated assets or depletion and degradation of natural resources. The origin of value added is determined by the International Standard Industrial Classification (ISIC), revision 4. Note: For VAB countries, gross value added at factor cost is used as the denominator. | World Bank national accounts data, and OECD National Accounts data files. |
| NV.SRV.DISC.CD | Discrepancy in GDP, value added (current US$) | This is the discrepancy included in the value added of services, etc. Covered here are any discrepancies noted by national compilers as well as discrepancies arising from linking new and old series in the World Bank data base. Data are in current U.S. dollars. | World Bank national accounts data, and OECD National Accounts data files. |
| NV.SRV.DISC.CN | Discrepancy in GDP, value added (current LCU) | This is the discrepancy included in the value added of services, etc. Covered here are any discrepancies noted by national compilers as well as discrepancies arising from linking new and old series in the World Bank data base. Data are in current local currency. | World Bank national accounts data, and OECD National Accounts data files. |
| NV.SRV.DISC.KN | Discrepancy in GDP, value added (constant LCU) | This is the discrepancy included in the value added of services, etc. Covered here are any discrepancies noted by national compilers as well as discrepancies arising from linking new and old series in the World Bank data base. Data are in constant local currency. | World Bank national accounts data, and OECD National Accounts data files. |
| NV.SRV.TOTL.ZS | Services, value added (% of GDP) | Services correspond to ISIC divisions 50-99 and they include value added in wholesale and retail trade (including hotels and restaurants), transport, and government, financial, professional, and personal services such as education, health care, and real estate services. Also included are imputed bank service charges, import duties, and any statistical discrepancies noted by national compilers as well as discrepancies arising from rescaling. Value added is the net output of a sector after adding up all outputs and subtracting intermediate inputs. It is calculated without making deductions for depreciation of fabricated assets or depletion and degradation of natural resources. The industrial origin of value added is determined by the International Standard Industrial Classification (ISIC), revision 3 or 4. | World Bank national accounts data, and OECD National Accounts data files. |
| NY.ADJ.NNTY.KD.ZS | Adjusted net national income (real, % of GDP) | Adjusted net national income is GNI minus consumption of fixed capital and natural resources depletion. | World Bank staff estimates based on sources and methods in World Bank’s “The Changing Wealth of Nations: Measuring Sustainable Development in the New Millennium” (2011). |
| NY.AGR.SUBS.GD.ZS | Agricultural support estimate (% of GDP) | Agriculture support is the annual monetary value of all gross transfers from taxpayers and consumers, both domestic and foreign (in the form of subsidies arising from policy measures that support agriculture), net of the associated budgetary receipts, regardless of their objectives and impacts on farm production and income, or consumption of farm products. | Organisation for Economic Co-operation and Development, Producer and Consumer Support Estimates database. Available online at www.oecd.org/tad/support/psecse. |
| NY.GDP.COAL.RT.ZS | Coal rents (% of GDP) | Coal rents are the difference between the value of both hard and soft coal production at world prices and their total costs of production. | World Bank staff estimates based on sources and methods described in the World Bank’s The Changing Wealth of Nations. |
| NY.GDP.DEFL.KD.ZG | Inflation, GDP deflator (annual %) | Inflation as measured by the annual growth rate of the GDP implicit deflator shows the rate of price change in the economy as a whole. The GDP implicit deflator is the ratio of GDP in current local currency to GDP in constant local currency. | World Bank national accounts data, and OECD National Accounts data files. |
| NY.GDP.DEFL.KD.ZG.AD | Inflation, GDP deflator: linked series (annual %) | Inflation as measured by the annual growth rate of the GDP implicit deflator shows the rate of price change in the economy as a whole. This series has been linked to produce a consistent time series to counteract breaks in series over time due to changes in base years, source data and methodologies. Thus, it may not be comparable with other national accounts series in the database for historical years. | World Bank staff estimates based on World Bank national accounts data archives, OECD National Accounts, and the IMF WEO database. |
| NY.GDP.DEFL.ZS | GDP deflator (base year varies by country) | The GDP implicit deflator is the ratio of GDP in current local currency to GDP in constant local currency. The base year varies by country. | World Bank national accounts data, and OECD National Accounts data files. |
| NY.GDP.DEFL.ZS.AD | GDP deflator: linked series (base year varies by country) | The GDP implicit deflator is calculated as the ratio of GDP in current local currency to GDP in constant local currency. This series has been linked to produce a consistent time series to counteract breaks in series over time due to changes in base years, source data and methodologies. Thus, it may not be comparable with other national accounts series in the database for historical years. The base year varies by country. | World Bank staff estimates based on World Bank national accounts data archives, OECD National Accounts, and the IMF WEO database. |
| NY.GDP.DISC.CD | Discrepancy in expenditure estimate of GDP (current US$) | This is the discrepancy included in the ‘total consumption etc.’ This discrepancy is included to ensures that GDP from the expenditure side equals GDP measured by the income or output approach. Data are in current U.S. dollars. | World Bank national accounts data, and OECD National Accounts data files. |
| NY.GDP.DISC.CN | Discrepancy in expenditure estimate of GDP (current LCU) | Discrepancy in expenditure estimate of GDP is the discrepancy included in final consumption expenditure, etc. (total consumption, etc.). This discrepancy is included to ensure that GDP from the expenditure side equals GDP measured by the income or output approach. Data are in current local currency. | World Bank national accounts data, and OECD National Accounts data files. |
| NY.GDP.DISC.KN | Discrepancy in expenditure estimate of GDP (constant LCU) | A statistical discrepancy usually arises when the GDP components are estimated independently by industrial origin and by expenditure categories. This item represents the discrepancy in the use of resources (i.e., the estimate of GDP by expenditure categories). Data are in constant local currency. | World Bank national accounts data, and OECD National Accounts data files. |
| NY.GDP.FRST.RT.ZS | Forest rents (% of GDP) | Forest rents are roundwood harvest times the product of regional prices and a regional rental rate. | World Bank staff estimates based on sources and methods described in the World Bank’s The Changing Wealth of Nations. |
| NY.GDP.MINR.RT.ZS | Mineral rents (% of GDP) | Mineral rents are the difference between the value of production for a stock of minerals at world prices and their total costs of production. Minerals included in the calculation are tin, gold, lead, zinc, iron, copper, nickel, silver, bauxite, and phosphate. | World Bank staff estimates based on sources and methods described in the World Bank’s The Changing Wealth of Nations. |
| NY.GDP.MKTP.CD | GDP (current US$) | GDP at purchaser’s prices is the sum of gross value added by all resident producers in the economy plus any product taxes and minus any subsidies not included in the value of the products. It is calculated without making deductions for depreciation of fabricated assets or for depletion and degradation of natural resources. Data are in current U.S. dollars. Dollar figures for GDP are converted from domestic currencies using single year official exchange rates. For a few countries where the official exchange rate does not reflect the rate effectively applied to actual foreign exchange transactions, an alternative conversion factor is used. | World Bank national accounts data, and OECD National Accounts data files. |
| NY.GDP.MKTP.CN | GDP (current LCU) | GDP at purchaser’s prices is the sum of gross value added by all resident producers in the economy plus any product taxes and minus any subsidies not included in the value of the products. It is calculated without making deductions for depreciation of fabricated assets or for depletion and degradation of natural resources. Data are in current local currency. | World Bank national accounts data, and OECD National Accounts data files. |
| NY.GDP.MKTP.CN.AD | GDP: linked series (current LCU) | GDP is the sum of gross value added by all resident producers in the economy plus any product taxes and minus any subsidies not included in the value of the products. It is calculated without making deductions for depreciation of fabricated assets or for depletion and degradation of natural resources. This series has been linked to produce a consistent time series to counteract breaks in series over time due to changes in base years, source data and methodologies. Thus, it may not be comparable with other national accounts series in the database for historical years. Data are in current local currency. | World Bank staff estimates based on World Bank national accounts data archives, OECD National Accounts, and the IMF WEO database. |
| NY.GDP.MKTP.KD | GDP (constant 2015 US$) | GDP at purchaser’s prices is the sum of gross value added by all resident producers in the economy plus any product taxes and minus any subsidies not included in the value of the products. It is calculated without making deductions for depreciation of fabricated assets or for depletion and degradation of natural resources. Data are in constant 2015 prices, expressed in U.S. dollars. Dollar figures for GDP are converted from domestic currencies using 2015 official exchange rates. For a few countries where the official exchange rate does not reflect the rate effectively applied to actual foreign exchange transactions, an alternative conversion factor is used. | World Bank national accounts data, and OECD National Accounts data files. |
| NY.GDP.MKTP.KD.ZG | GDP growth (annual %) | Annual percentage growth rate of GDP at market prices based on constant local currency. Aggregates are based on constant 2015 prices, expressed in U.S. dollars. GDP is the sum of gross value added by all resident producers in the economy plus any product taxes and minus any subsidies not included in the value of the products. It is calculated without making deductions for depreciation of fabricated assets or for depletion and degradation of natural resources. | World Bank national accounts data, and OECD National Accounts data files. |
| NY.GDP.MKTP.KN | GDP (constant LCU) | GDP is the sum of gross value added by all resident producers in the economy plus any product taxes and minus any subsidies not included in the value of the products. It is calculated without making deductions for depreciation of fabricated assets or for depletion and degradation of natural resources. Data are in constant local currency. | World Bank national accounts data, and OECD National Accounts data files. |
| NY.GDP.MKTP.PP.CD | GDP, PPP (current international $) | This indicator provides values for gross domestic product (GDP) expressed in current international dollars, converted by purchasing power parity (PPP) conversion factor. GDP is the sum of gross value added by all resident producers in the country plus any product taxes and minus any subsidies not included in the value of the products. PPP conversion factor is a spatial price deflator and currency converter that eliminates the effects of the differences in price levels between countries. From April 2020, “GDP: linked series (current LCU)” [NY.GDP.MKTP.CN.AD] is used as underlying GDP in local currency unit so that it’s in line with time series of PPP conversion factors for GDP, which are extrapolated with linked GDP deflators. | International Comparison Program, World Bank World Development Indicators database, World Bank Eurostat-OECD PPP Programme. |
| NY.GDP.MKTP.PP.KD | GDP, PPP (constant 2017 international $) | PPP GDP is gross domestic product converted to international dollars using purchasing power parity rates. An international dollar has the same purchasing power over GDP as the U.S. dollar has in the United States. GDP is the sum of gross value added by all resident producers in the country plus any product taxes and minus any subsidies not included in the value of the products. It is calculated without making deductions for depreciation of fabricated assets or for depletion and degradation of natural resources. Data are in constant 2017 international dollars. | International Comparison Program, World Bank World Development Indicators database, World Bank Eurostat-OECD PPP Programme. |
| NY.GDP.MKTP.XU.E | GDP deflator, end period (base year varies by country) | The GDP implicit deflator is the ratio of GDP in current local currency to GDP in constant local currency. The base year varies by country. | World Bank national accounts data, and OECD National Accounts data files. |
| NY.GDP.NGAS.RT.ZS | Natural gas rents (% of GDP) | Natural gas rents are the difference between the value of natural gas production at regional prices and total costs of production. | World Bank staff estimates based on sources and methods described in the World Bank’s The Changing Wealth of Nations. |
| NY.GDP.PCAP.CD | GDP per capita (current US$) | GDP per capita is gross domestic product divided by midyear population. GDP is the sum of gross value added by all resident producers in the economy plus any product taxes and minus any subsidies not included in the value of the products. It is calculated without making deductions for depreciation of fabricated assets or for depletion and degradation of natural resources. Data are in current U.S. dollars. | World Bank national accounts data, and OECD National Accounts data files. |
| NY.GDP.PCAP.CN | GDP per capita (current LCU) | GDP per capita is gross domestic product divided by midyear population. GDP is the sum of gross value added by all resident producers in the economy plus any product taxes and minus any subsidies not included in the value of the products. It is calculated without making deductions for depreciation of fabricated assets or for depletion and degradation of natural resources. Data are in current local currency. | World Bank national accounts data, and OECD National Accounts data files. |
| NY.GDP.PCAP.KD | GDP per capita (constant 2015 US$) | GDP per capita is gross domestic product divided by midyear population. GDP is the sum of gross value added by all resident producers in the economy plus any product taxes and minus any subsidies not included in the value of the products. It is calculated without making deductions for depreciation of fabricated assets or for depletion and degradation of natural resources. Data are in constant 2015 U.S. dollars. | World Bank national accounts data, and OECD National Accounts data files. |
| NY.GDP.PCAP.KD.ZG | GDP per capita growth (annual %) | Annual percentage growth rate of GDP per capita based on constant local currency. GDP per capita is gross domestic product divided by midyear population. GDP at purchaser’s prices is the sum of gross value added by all resident producers in the economy plus any product taxes and minus any subsidies not included in the value of the products. It is calculated without making deductions for depreciation of fabricated assets or for depletion and degradation of natural resources. | World Bank national accounts data, and OECD National Accounts data files. |
| NY.GDP.PCAP.KN | GDP per capita (constant LCU) | GDP per capita is gross domestic product divided by midyear population. GDP at purchaser’s prices is the sum of gross value added by all resident producers in the economy plus any product taxes and minus any subsidies not included in the value of the products. It is calculated without making deductions for depreciation of fabricated assets or for depletion and degradation of natural resources. Data are in constant local currency. | World Bank national accounts data, and OECD National Accounts data files. |
| NY.GDP.PCAP.PP.CD | GDP per capita, PPP (current international $) | This indicator provides per capita values for gross domestic product (GDP) expressed in current international dollars converted by purchasing power parity (PPP) conversion factor. GDP is the sum of gross value added by all resident producers in the country plus any product taxes and minus any subsidies not included in the value of the products. conversion factor is a spatial price deflator and currency converter that controls for price level differences between countries. Total population is a mid-year population based on the de facto definition of population, which counts all residents regardless of legal status or citizenship. | International Comparison Program, World Bank World Development Indicators database, World Bank Eurostat-OECD PPP Programme. |
| NY.GDP.PCAP.PP.KD | GDP per capita, PPP (constant 2017 international $) | GDP per capita based on purchasing power parity (PPP). PPP GDP is gross domestic product converted to international dollars using purchasing power parity rates. An international dollar has the same purchasing power over GDP as the U.S. dollar has in the United States. GDP at purchaser’s prices is the sum of gross value added by all resident producers in the country plus any product taxes and minus any subsidies not included in the value of the products. It is calculated without making deductions for depreciation of fabricated assets or for depletion and degradation of natural resources. Data are in constant 2017 international dollars. | International Comparison Program, World Bank World Development Indicators database, World Bank Eurostat-OECD PPP Programme. |
| NY.GDP.PETR.RT.ZS | Oil rents (% of GDP) | Oil rents are the difference between the value of crude oil production at regional prices and total costs of production. | World Bank staff estimates based on sources and methods described in the World Bank’s The Changing Wealth of Nations. |
| NY.GDP.TOTL.RT.ZS | Total natural resources rents (% of GDP) | Total natural resources rents are the sum of oil rents, natural gas rents, coal rents (hard and soft), mineral rents, and forest rents. | World Bank staff estimates based on sources and methods described in the World Bank’s The Changing Wealth of Nations. |
| NY.GDS.TOTL.ZS | Gross domestic savings (% of GDP) | Gross domestic savings are calculated as GDP less final consumption expenditure (total consumption). | World Bank national accounts data, and OECD National Accounts data files. |
| NY.GNS.ICTR.ZS | Gross savings (% of GDP) | Gross savings are calculated as gross national income less total consumption, plus net transfers. | World Bank national accounts data, and OECD National Accounts data files. |
| PA.NUS.PPP | PPP conversion factor, GDP (LCU per international $) | Purchasing power parity (PPP) conversion factor is a spatial price deflator and currency converter that controls for price level differences between countries, thereby allowing volume comparisons of gross domestic product (GDP) and its expenditure components. This conversion factor is for GDP. | International Comparison Program, World Bank World Development Indicators database, World Bank Eurostat-OECD PPP Programme. |
| PA.NUS.PPPC.RF | Price level ratio of PPP conversion factor (GDP) to market exchange rate | Price level ratio is the ratio of a purchasing power parity (PPP) conversion factor to an exchange rate. It provides a measure of the differences in price levels between countries by indicating the number of units of the common currency needed to buy the same volume of the aggregation level in each country. At the level of GDP, they provide a measure of the differences in the general price levels of countries. | International Comparison Program, World Bank World Development Indicators database, World Bank Eurostat-OECD PPP Programme. |
| SE.XPD.PRIM.PC.ZS | Government expenditure per student, primary (% of GDP per capita) | Government expenditure per student is the average general government expenditure (current, capital, and transfers) per student in the given level of education, expressed as a percentage of GDP per capita. | UNESCO Institute for Statistics (http://uis.unesco.org/). Data as of February 2020. |
| SE.XPD.SECO.PC.ZS | Government expenditure per student, secondary (% of GDP per capita) | Government expenditure per student is the average general government expenditure (current, capital, and transfers) per student in the given level of education, expressed as a percentage of GDP per capita. | UNESCO Institute for Statistics (http://uis.unesco.org/). Data as of February 2020. |
| SE.XPD.TERT.PC.ZS | Government expenditure per student, tertiary (% of GDP per capita) | Government expenditure per student is the average general government expenditure (current, capital, and transfers) per student in the given level of education, expressed as a percentage of GDP per capita. | UNESCO Institute for Statistics (http://uis.unesco.org/). Data as of February 2020. |
| SE.XPD.TOTL.GD.ZS | Government expenditure on education, total (% of GDP) | General government expenditure on education (current, capital, and transfers) is expressed as a percentage of GDP. It includes expenditure funded by transfers from international sources to government. General government usually refers to local, regional and central governments. | UNESCO Institute for Statistics (UIS). UIS.Stat Bulk Data Download Service. Accessed October 24, 2022. https://apiportal.uis.unesco.org/bdds. |
| SE.XPD.TOTL.PC.ZS | Expenditure per student, total (% of GDP per capita) | Public expenditure per student is the public current spending on education divided by the total number of students, as a percentage of GDP per capita. Public expenditure (current and capital) includes government spending on educational institutions (both public and private), education administration as well as subsidies for private entities (students/households and other privates entities). | N/A |
| SH.XPD.CHEX.GD.ZS | Current health expenditure (% of GDP) | Level of current health expenditure expressed as a percentage of GDP. Estimates of current health expenditures include healthcare goods and services consumed during each year. This indicator does not include capital health expenditures such as buildings, machinery, IT and stocks of vaccines for emergency or outbreaks. | World Health Organization Global Health Expenditure database (http://apps.who.int/nha/database). The data was retrieved on April 7, 2023. |
| SH.XPD.GHED.GD.ZS | Domestic general government health expenditure (% of GDP) | Public expenditure on health from domestic sources as a share of the economy as measured by GDP. | World Health Organization Global Health Expenditure database (http://apps.who.int/nha/database). The data was retrieved on April 7, 2023. |
| SH.XPD.KHEX.GD.ZS | Capital health expenditure (% of GDP) | Level of capital investments on health expressed as a percentage of GDP. Capital health investments include health infrastructure (buildings, machinery, IT) and stocks of vaccines for emergency or outbreaks. | World Health Organization Global Health Expenditure database (http://apps.who.int/nha/database). The data was retrieved on April 7, 2023. |
| SH.XPD.PRIV.ZS | Health expenditure, private (% of GDP) | Private health expenditure includes direct household (out-of-pocket) spending, private insurance, charitable donations, and direct service payments by private corporations. | World Health Organization Global Health Expenditure database (see http://apps.who.int/nha/database for the most recent updates). |
| SH.XPD.PUBL.ZS | Health expenditure, public (% of GDP) | Public health expenditure consists of recurrent and capital spending from government (central and local) budgets, external borrowings and grants (including donations from international agencies and nongovernmental organizations), and social (or compulsory) health insurance funds. | World Health Organization Global Health Expenditure database (see http://apps.who.int/nha/database for the most recent updates). |
| SH.XPD.TOTL.ZS | Health expenditure, total (% of GDP) | Total health expenditure is the sum of public and private health expenditure. It covers the provision of health services (preventive and curative), family planning activities, nutrition activities, and emergency aid designated for health but does not include provision of water and sanitation. | World Health Organization Global Health Expenditure database (see http://apps.who.int/nha/database for the most recent updates). |
| SL.GDP.PCAP.EM.KD | GDP per person employed (constant 2017 PPP $) | GDP per person employed is gross domestic product (GDP) divided by total employment in the economy. Purchasing power parity (PPP) GDP is GDP converted to 2017 constant international dollars using PPP rates. An international dollar has the same purchasing power over GDP that a U.S. dollar has in the United States. | World Bank, World Development Indicators database. Estimates are based on employment, population, GDP, and PPP data obtained from International Labour Organization, United Nations Population Division, Eurostat, OECD, and World Bank. |
| SL.GDP.PCAP.EM.KD.ZG | GDP per person employed (annual % growth) | Annual growth rate for GDP per person employed. GDP per person employed is gross domestic product (GDP) divided by total employment. GDP is converted to 2017 international dollars using purchasing power parity rates. An international dollar has the same purchasing power over GDP as the U.S. dollar has in the United States. | World Bank, World Development Indicators database. Estimates are based on employment, population, GDP, and PPP data obtained from International Labour Organization, United Nations Population Division, Eurostat, OECD, and World Bank. |
| SL.GDP.PCAP.EM.XD | GDP per person employed, index (2000 = 100) | GDP per person employed is presented as an index with base year 2000 = 100. GDP per person employed is gross domestic product (GDP) divided by total employment. | Derived using data from International Labour Organization, ILOSTAT database. The data retrieved in June 21, 2020. |
| TG.VAL.TOTL.GD.ZS | Merchandise trade (% of GDP) | Merchandise trade as a share of GDP is the sum of merchandise exports and imports divided by the value of GDP, all in current U.S. dollars. | World Trade Organization, and World Bank GDP estimates. |
After reading the (long) table above, we will use NY.GDP.MKTP.PP.KD, that is the GDP in 2017 international dollars, using purchasing power parity, or PPP. Data is organized around regions, where a region is defined as group of countries, for example the countries in the European Union, of the ones in the OECD. The list of all regions in obtained using wb.region.list(), from which we can see the region name (a 3-letter identifier) and a code (a longer, human-readable description).
for region in wb.region.list():
    print(region['code'], '=>', region['name'])
AFE => Africa Eastern and Southern
AFR => Africa
AFW => Africa Western and Central
ARB => Arab World
CAA => Sub-Saharan Africa (IFC classification)
CEA => East Asia and the Pacific (IFC classification)
CEB => Central Europe and the Baltics
CEU => Europe and Central Asia (IFC classification)
CLA => Latin America and the Caribbean (IFC classification)
CME => Middle East and North Africa (IFC classification)
CSA => South Asia (IFC classification)
CSS => Caribbean small states
EAP => East Asia & Pacific (excluding high income)
EAR => Early-demographic dividend
EAS => East Asia & Pacific
ECA => Europe & Central Asia (excluding high income)
ECS => Europe & Central Asia
EMU => Euro area
EUU => European Union
FCS => Fragile and conflict affected situations
HPC => Heavily indebted poor countries (HIPC)
LAC => Latin America & Caribbean (excluding high income)
LCN => Latin America & Caribbean
LDC => Least developed countries: UN classification
LTE => Late-demographic dividend
MDE => Middle East (developing only)
MEA => Middle East & North Africa
MNA => Middle East & North Africa (excluding high income)
NAC => North America
NAF => North Africa
NRS => Non-resource rich Sub-Saharan Africa countries
OED => OECD members
OSS => Other small states
PRE => Pre-demographic dividend
PSS => Pacific island small states
PST => Post-demographic dividend
RRS => Resource rich Sub-Saharan Africa countries
SAS => South Asia
SSA => Sub-Saharan Africa (excluding high income)
SSF => Sub-Saharan Africa
SST => Small states
SXZ => Sub-Saharan Africa excluding South Africa
WLD => World
XZN => Sub-Saharan Africa excluding South Africa and Nigeria
The most comprehensive resion is WLD, or World, which clearly includes all country on Earth. Using wb.region.members() we can get the list of all countries, returned in a format that is easy to visualize by a bit more difficult to exploit programmatically: to extract the information of a country, we need to use a wb.economy.coder_report(), which we will do once and use it to populate some data structures to convert from region names to region codes and viceversa.
country_codes = sorted(list(wb.region.members('WLD')))
print(f'Found {len(country_codes)} countries in the region World.')
country_names = [wb.economy.coder_report(wb.economy.coder([code]))[1][1] for code in country_codes]
Found 218 countries in the region World.
country_code_to_name = {c: n for (c, n) in zip(country_codes, country_names)}
country_name_to_code = {n: c for (c, n) in zip(country_codes, country_names)}
We select a small group of similar countries: the largest, in terms of population, in Europe: Germany, France, United Kingdom, Italy, Spain, Poland, the Netherlands, and Romania. The GDP will be scaled to express the results in billions of dollars, and we look at the data after the introduction of the Euro, that is 1999. We are interested in the evolution of the GDP in relative terms from that moment.
indicator = 'NY.GDP.MKTP.PP.KD'
description = 'GDP, PPP (constant 2017 international $)'
df = wb.data.DataFrame(indicator)
df.columns = pd.to_datetime(df.columns, format='YR%Y')
df /= 1_000_000_000  # results in billions
selected_countries = ['DEU', 'FRA', 'GBR', 'ITA', 'ESP', 'POL', 'NLD', 'ROU']
palette = sns.color_palette()
fig, (ax0, ax1) = plt.subplots(figsize=(10, 4), ncols=2)

for country, color in zip(selected_countries, palette):
    series = df.loc[country].dropna().T
    series = series[series.index >= '1999-01-01']
    series = 100 * series / series['1999-01-01']
    ax0.plot(series, linewidth=4, color=color)
ax0.set_xlabel('Year')
ax0.set_ylabel('GDP(Year)/GDP(1999), %')
ax0.set_title(description + ', Relative to 2000')

ax0.text(datetime(2010, 8, 1), 110, country_code_to_name['DEU'], color=palette[0])
ax0.text(datetime(2019, 6, 1), 116, country_code_to_name['FRA'], color=palette[1])
ax0.text(datetime(2016, 6, 1), 147, country_code_to_name['GBR'], color=palette[2])
ax0.text(datetime(2018, 1, 1), 95, country_code_to_name['ITA'], color=palette[3])
ax0.text(datetime(2008, 1, 1), 136, country_code_to_name['ESP'], color=palette[4])
ax0.text(datetime(2017, 8, 1), 190, country_code_to_name['POL'], color=palette[5])
ax0.text(datetime(2014, 1, 1), 115, country_code_to_name['NLD'], color=palette[6])
ax0.text(datetime(2008, 1, 1), 173, country_code_to_name['ROU'], color=palette[7])
ax0.axhline(y=100, linestyle='dashed', color='grey')

ax1.bar(range(len(selected_countries)), [df.loc[country].dropna().T.values[-1] for country in selected_countries], color=palette)
ax1.set_title(description + ', 2021')
ax1.set_ylabel('Constant 2017 International $, Billions')
for i, country in enumerate(selected_countries):
    plt.text(i - 0.1, 150, country_code_to_name[country], rotation=90, color='black')
ax1.set_xticklabels([])
fig.tight_layout()
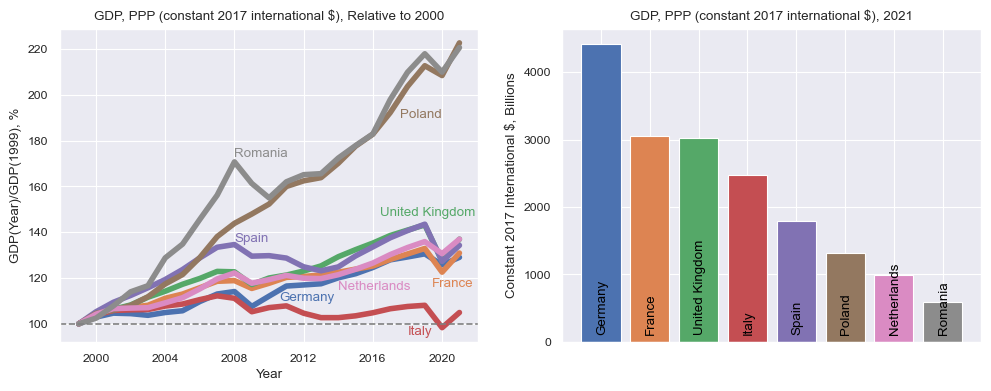
Two countries have made significant progress since 1999: Romania and Poland, more than doubling the GDP, in PPP terms. Most of the other big countries have evoled in similar way, with Spain growing significantly more up to the 2008 crisis, then reverting to the level of the other countries. Italy is on its own, with almost no evolution of the GDP relative to the moment when the Euro was introduced. The barplot on the right shows the GDP, always in PPP, for 2021, which is the most recent data in the dataset.
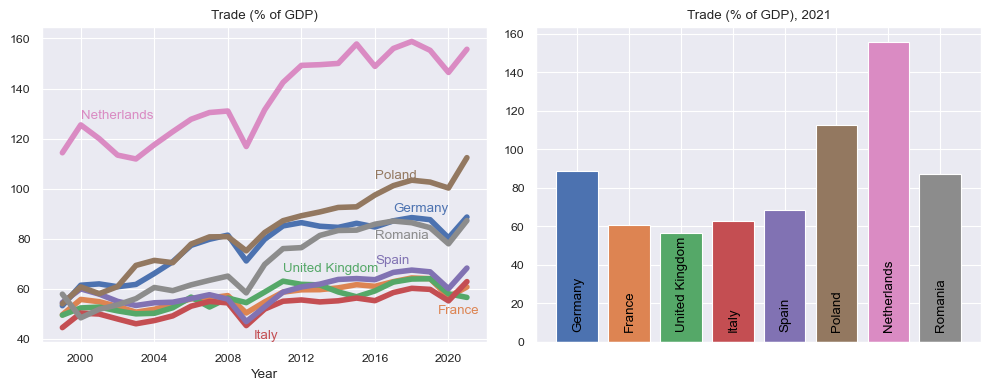
We repeat the same exercise with another indicator, NE.TRD.GNFS.ZS, which reports the trade as percentage of the GDP, with the same countries.
indicator = 'NE.TRD.GNFS.ZS'
description = 'Trade (% of GDP)'
df = wb.data.DataFrame(indicator)
df.columns = pd.to_datetime(df.columns, format='YR%Y')
selected_countries = ['DEU', 'FRA', 'GBR', 'ITA', 'ESP', 'POL', 'NLD', 'ROU']
palette = sns.color_palette()

fig, (ax0, ax1) = plt.subplots(figsize=(10, 4), ncols=2)

for country, color in zip(selected_countries, palette):
    series = df.loc[country].dropna().T
    series = series[series.index >= '1999-01-01']
    ax0.plot(series, linewidth=4, color=color)
ax0.set_xlabel('Year')
ax0.set_title(description)

ax0.text(datetime(2017, 1, 1), 91, country_code_to_name['DEU'], color=palette[0])
ax0.text(datetime(2019, 6, 1), 50, country_code_to_name['FRA'], color=palette[1])
ax0.text(datetime(2011, 1, 1), 67, country_code_to_name['GBR'], color=palette[2])
ax0.text(datetime(2009, 6, 1), 40, country_code_to_name['ITA'], color=palette[3])
ax0.text(datetime(2016, 1, 1), 70, country_code_to_name['ESP'], color=palette[4])
ax0.text(datetime(2016, 1, 1), 104, country_code_to_name['POL'], color=palette[5])
ax0.text(datetime(2000, 1, 1), 128, country_code_to_name['NLD'], color=palette[6])
ax0.text(datetime(2016, 1, 1), 80, country_code_to_name['ROU'], color=palette[7])
# ax0.axhline(y=100, linestyle='dashed', color='grey')

ax1.bar(range(len(selected_countries)), [df.loc[country].dropna().T.values[-1] for country in selected_countries], color=palette)
ax1.set_title(description + ', 2021')
for i, country in enumerate(selected_countries):
    plt.text(i - 0.1, 7, country_code_to_name[country], rotation=90, color='black')
ax1.set_xticklabels([])
fig.tight_layout()
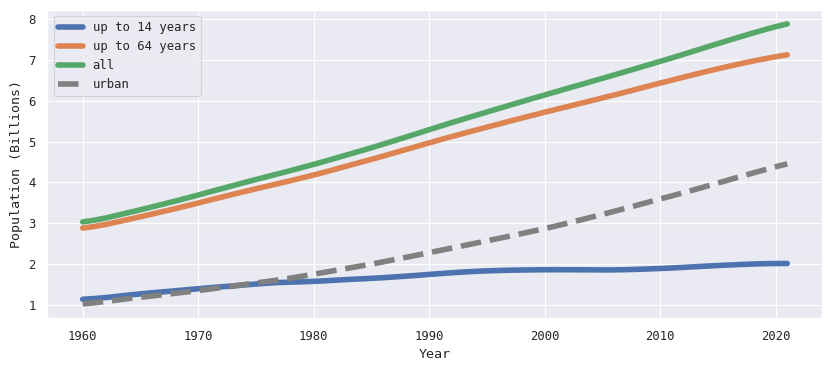
We finish this article with an overview of the world population. The indicators are SP.POP.0014.TO for the total population up to 14 years old, SP.POP.1564.TO for the population between 15 and 64 years old, and SP.POP.65UP.TO for the population of 65 years old and above. We also plot SP.URB.TOTL, which is the total urban population.
indicators = ['SP.POP.0014.TO', 'SP.POP.1564.TO', 'SP.POP.65UP.TO', 'SP.URB.TOTL']
df = wb.data.DataFrame(indicators, economy='WLD')
df.columns = pd.to_datetime(df.columns, format='YR%Y')
df = df.T / 1_000_000_000
import matplotlib
matplotlib.rc('font', family='monospace')
fig, ax = plt.subplots(figsize=(10, 4))

df['00-14'] = df['SP.POP.0014.TO']
df['00-64'] = df['00-14'] + df['SP.POP.1564.TO']
df['00-UP'] = df['00-64'] + df['SP.POP.65UP.TO']

ax.plot(df.index, df['00-14'], label='up to 14 years', linewidth=4)
ax.plot(df.index, df['00-64'], label='up to 64 years', linewidth=4)
ax.plot(df.index, df['00-UP'], label='all', linewidth=4)
ax.plot(df.index, df['SP.URB.TOTL'], linestyle='dashed', color='grey', label='urban', linewidth=4)
ax.set_xlabel('Year')
ax.set_ylabel('Population (Billions)')
plt.legend(loc='upper left');